Thursday, March 31, 2016

Geocoding

This week we spent time learning what network analysis is and how to perform this in ArcGIS.  So essentially I was able to learn what the mechanism behind google maps directions are (though I'm sure it's more complicated than what we dealt with...because of computer languages etc.)

First we had to gather the data starting with TIGER lines (I love the American..er sorry...USG's love of creating acronyms for everything) from the US Census Bureau's website. Well, this was was actually a pain in the ass for me. I live in China and there's this thing they do, where they censor the whole internet including a lot of USG websites. This is not a cool thing (partly why I'm moving out of this repressive country after only a few months of living here). My VPN, for some reason, couldn't connect to the website. After much frustration, I switched to my other VPN which worked (never doubt the simplest solutions to any problem in life).

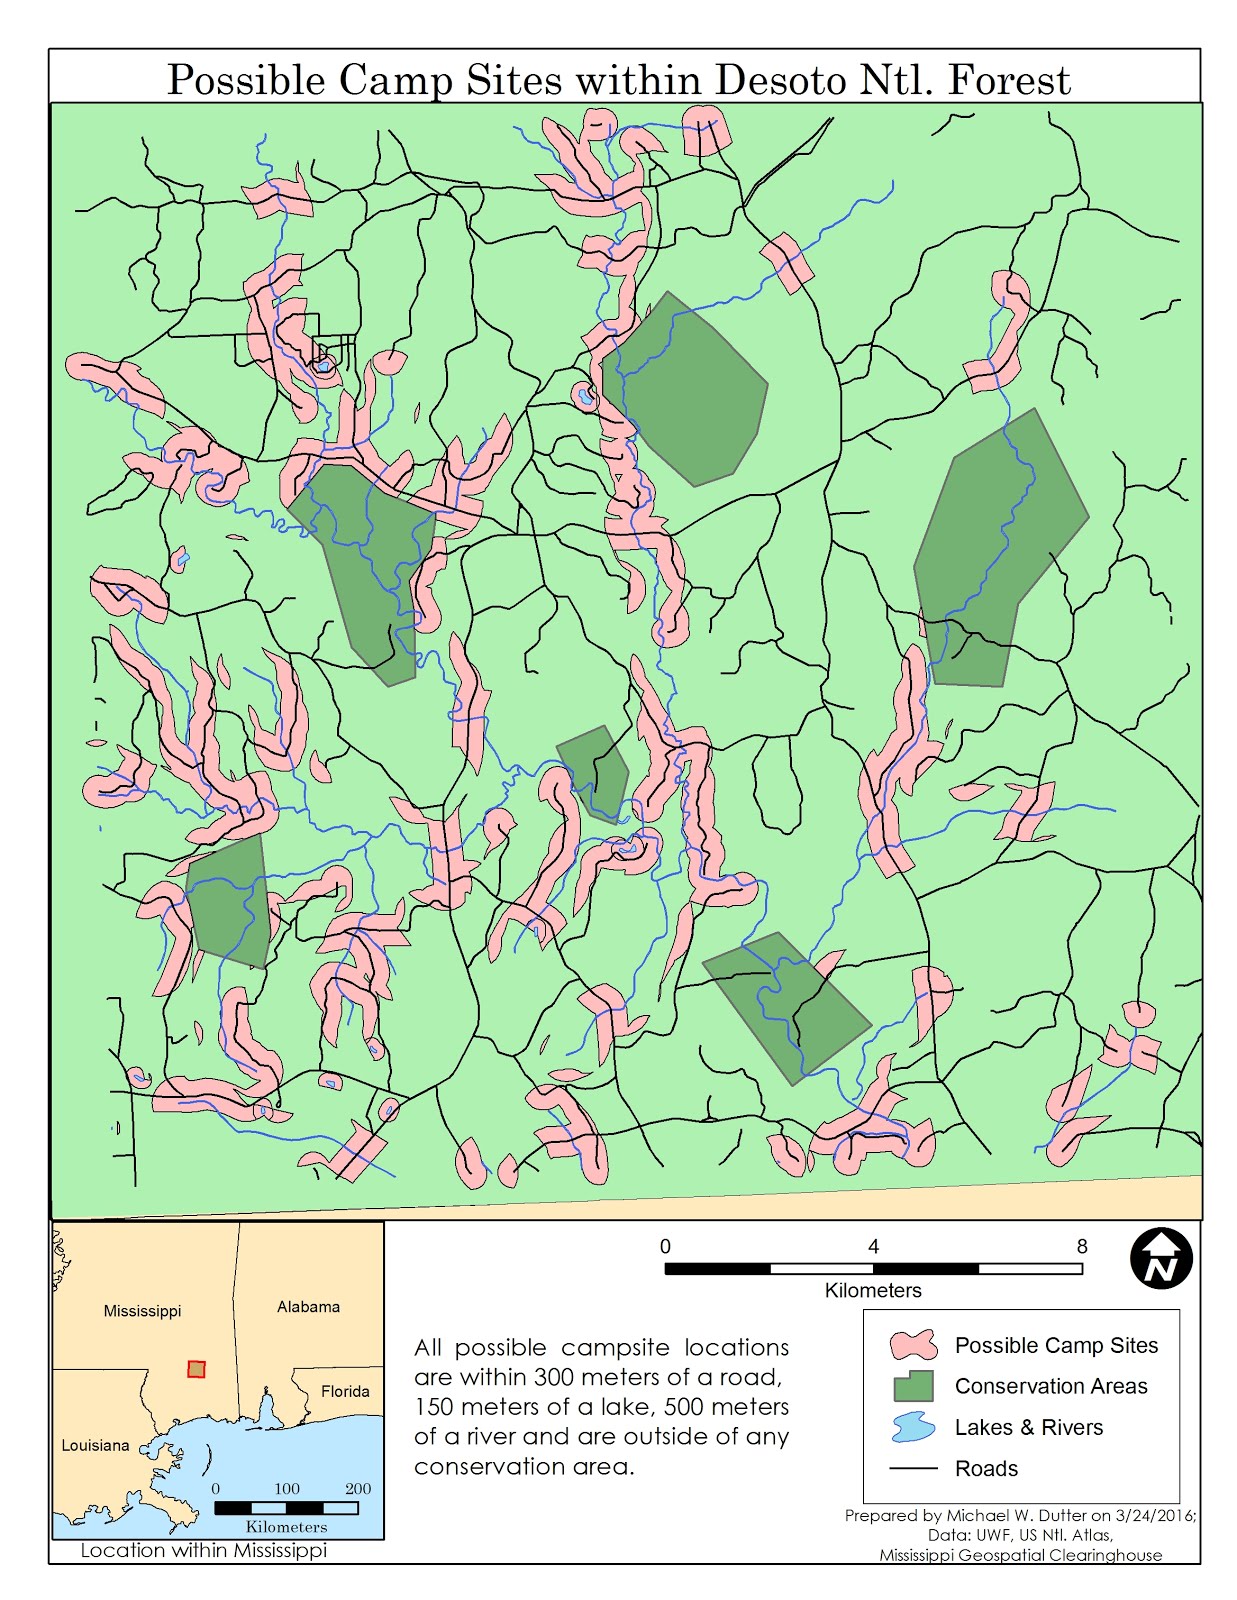
Once I had the data needed, I followed the lovely pdf instructions and created a Lake_Roads file for Lake County. I then proceeded to add a smattering of data files (new and old alike) to the Lake County database. Many of the files I added, such as the water, county boundaries, etc were from past modules. I then clipped, exported, re-projected, etc my way through them until I had a set of data that I could work with to make the best possible map. I ended up creating a new water features layer by cutting out water features under 1.5 sq km (I never realized how much water Florida has...it can really clutter a map). I wanted to include the water inside lake county, because the many lakes in Lake County had a real impact on the network of roads and I felt it best to ensure my audience is aware of the "lakeyness" of Lake County.

After my data was arranged into feature classes I created the address locator using the EMS file. The matching of unmatched addresses was a little interesting. I matched using the map for all of them, as each time I added said address to google maps they were no where near the ones on the candidate list (those that had candidates anyway). After I matched the unmatched with the assistance of google maps, I then created the Geocoded results.

I picked the three stations you see displayed in the insert and performed the route network analysis creating the nice blue line. I kept the line in both data frames. For the EMS stations, I selected the cross and had them labeled according to their station number. Using the station numbers I could list all of the addresses in the box on the lower right hand corner of the map. I decided to have the stops look the same as the rest, only I kept the color blue. You'll notice I didn't add the stops to the legend. Here I'm assuming the audience can figure out that those are stops from the numbered order of each stop (1...2...3) and from the title of the insert map "Best Route from Station 141 to 241 to 231".  I was trying to decrease clutter, aiming for minimalism. I attempted to make the EMS stations as preeminent as possible by sort of washing the county out with the color scheme while still trying to make sure the street network was visible.

Hope you like it! 


A map displaying EMS stations in Lake County, Fl.
The insert shows the best possible route for 3 of those stations.
The addresses of the stations are displayed based on the station number,
which are labeled on the map it's self.

Sunday, March 27, 2016

Dot Pop!

This weeks class focused on creating a "dot density" map. Essentially, it's a map that has a lot of little dots that represents certain data (in our case, one dot representing many, one-to-many). We had to create a map showing population density in South Florida. Each dot represents 5,000 people. The interesting part about dot mapping with one-to-many dots that they are randomly distributed and do not correspond to geographic points. Though I tried so hard to get the dots to only appear within urban areas, ArcGIS being the ever expensive glitchy  program it is, crashed repeatedly. So I had to make do with excluding the dots from the water layer.

I created this map entirely in ArcGIS, never using AI once (I know, I know, I can't believe it either. It's such a good looking map). The first step in creating any map is figuring out the base layers and the colors to use. I went with natural colors. A blue background (the sea) and a light green for the south Florida area. You'll notice a grayed out section of Florida to the north. This is the county layers from previous modules. I decided to include this layer to create continuity instead of making south Florida look like it had been hacked off and is floating in a nebulous space.It think it's quite clear that the green area is the area we're concerned with. For the water layer, I used a layer from a previous module as opposed to the one given to us. I did this because, the water layer you see is more refined and shows major water sources. The layer given to us for Module 10 was all water and instead of taking hours to clean up that layer, I took the easy route and just clipped this layer! ( I think it was from my Intro to GIS class). For the colors, a dark blue for the lakes and a lighter blue for the streams. As for the wetlands,I went with the ESRI wetland but removed the background color and changed the foreground color to blue. By removing the background color, it allows the wetland feaure to blend into the green of the county layer map. For the urban areas, I went with the color you see. I think it's easy to see on the map while not conflicting with the colors. Essentially, it's not jarring to the eye. I then included an insert map using a US State boundary shape file I had on my computer. Next was the cities. I went with the following cities because I felt they gave the best reference points on either coast. Originally, I was using the city picture to represent the cities on the map, however, when the dots were added, the cities became covered in red dots and it was hard to see not aesthetically pleasing. Instead, I went with the circle dot and turned it blue. It's easier to see when the dots were added. The dots, I decided to go with red. Red is easy to see against blue and green. Also, the red made the dots the most prominent feature.

For the dots, I tried to have them mask by the urban layer. However, every time I attempted to mask it to be only in the urban area, Arc crashed. I tried changing the ordering of the layers. I tried deleting everything and relayer it and masking it different times in different ways. But every time I selected the urban layer and try to mask the dots to only appear there, it crashed. So I had to settle with excluding the water layer. This then inspired me to write a summary about the map (something we've done on other maps in the class and in the intro to GIS course). I wanted to make it clear that the dots are not geographic points. (Not one to one dots). Originally, I went with dots that represented 15,000 people but I felt it wasn't accurate. Instead, I went with each dot representing 5,000 people.
Dot Density map of overall population in South Florida. As the disclaimer explains above, the dots are not geographic points. The map was created entirely in ArcGIS. 

Thursday, March 24, 2016

Bufferin'

This weeks class objective was ti use buffer tools to perform a vector analysis. The task was to determine the best possible location for camp sites based on certain parameters. We were given feature classes of roads, rivers, lakes and conservation areas within Desoto National Forest.

First, before I dove into the pdf guide, I downloaded some shape files from the Mississippi Geospatial Clearing house. (I knew where Desoto was located). The files were parks & reserves, state boundaries and county boundaries. I wanted to see where exactly this data was located as well as provide a base map to make it more aesthetically pleasing and detailed as opposed to having lines and polygons floating in an ambiguous space.  Using these layers, I figured out that the given feature classes were inside Desoto National Forest that was inside of Perry County, Mississippi (So, not the whole forest).

I then added the base layers and created an insert using the state boundary maps. I put our feature classes on top and then followed the pdf verbatim. The buffering was quite straight forward, if you knew what tool works best. We were tasked with joining the buffers of the rivers with the roads. I found the intersect tool worked best because it only took one step as opposed to several with the union. The next part was to find the buffers that intersected at within the buffers of both the water features (150m for lakes, 500 m for rivers) and the roads buffer (300m). Once I found those, I then had to erase buffers that were inside conservation areas. For this, I used the erase tool. Once I used the tools to determine the best places for camp sites, the next task was making it look good.

For that, I map the forest a light green. I left the conservation areas with a dark green. Though the examples given don't have the conservation areas displayed, I felt it best to display it so people could better understand how the best places to camp came to be. (If you knew the area within a certain distance of roads and water is where the best camp spots are  you would be curious why some of those spots were missing from the map even knowing that it excluded conservation areas.)
I then added the insert map, the title, legend, neatline and north area. I tried to keep the map simple in terms of placement and color to keep it aesthetically pleasing. When it comes to design, I'm a minimalist.

Map of possible camp sites in the Perry County portion of Desoto Natinal Forsest. The salmon color areas are the possible sites. An explnation of the map is in the lower portion between the legend and insert. 

Monday, March 14, 2016

Flowy Lines of Migrants

This week's lesson in cartography was in flow lines. Essentially, they're nice long, flowing lines with an arrow on one end. (In simplistic terms.) We were tasked with creating a flow line map that displays immigration by continent to the US. During this process I realized something, AI is not meant for maps. Thank god the file we were given already had the layers organized. Exporting an arc map to AI, creates such chaos on the layer front. I digress.

In making this map, I first considered how the lines would work. I decided to have all the lines run into each other. I did this to reduce clutter. I do regret, however, making each line a different color. Looking at it below, I feel it didn't quite come out the way I wanted. It's hard to see the Oceania line, for example. I then changed the color of each continent, except for the US. For the US, I changed the color to a red so it could stand out. Europe, sadly, looks washed out. (oh the pain of last minute work).  For the insert, I didn't go with an at scale. I blew up Hawaii and Alaska, though I kept their directionality. I made the legend in ArcGIS and then copied it over to AI.

I made a legend using the arrows and matching the arrows to the line width I figured out in the lab exercise (5pt being the maximum). I then put the respective number of immigrants next to each one.

I added drop shadows where I though would best show the lines and other information. Also, I like to keep things simple. I felt the large white border with the space to show my legend without a neatline, worked well. I felt my color choice on the map is also simple. The colors aren't too bright. I find the colors to be demur.

I like the central concept of flow lines, however, I'm I feel most stories can be told in better ways than with flow lines. They're thematic and can look compelling but also can clutter the map quite easily.

Sunday, March 6, 2016

Eye-SAH-Ryth-mik Mappin'

This week was isarithmic mapping...or how those contour and weather maps are made. Isarithmic mapping is different from choropeth mapping in that the data is not bound by enumeration units. Isarithmic mapping is good for data that doesn't correspond to to the artificiality of borders, data like weather patterns, other natural phenomena or even human activity that transcends enumeration units (population distribution as opposed to density). Isarithmic mapping works best with continuous smooth data.

First, in order to understand how isarithmic maps work, one needs to know interpolation of the data points. Enumeration units are not used, points are used instead. These points can be "true" (a weather station) or "conceptual" (data from over a larger area placed into one point). This, for me, wasn't that easy to grasp. Our book had tons of little formulas for the variety of interpolation it presented us with. I suppose though, knowing the basics is what's important because as a GIS user, I can better display and explain the information if I know the process that went into creating it. Like a car salesman who knows the basic of automotive assembly.

The objective for the lab was to use isarithmic mapping and display the data through 2 different symbologies. The first was continuous tone which shows colors or shades proportional to the data being displayed. In our case, the 30 years average of precipitation in Washington state.  The colors in a continuous tone map sort of flow into each other and I feel, is easy for any map reader to understand.

The second was hypsometric mapping. It's similar to continuous tone however it's used more to show how the data is impacted by elevation. I feel hypsoemetric mapping is somewhere in between choropeth mapping and the continuous tone symbology in that hypsoemtric almost creates clear breaks in the data. Those breaks are the change in elevation. It's useful when elevation's impact on the data is important. Below is the final map product, a hypsometric map with contours. The contour lines help to illustrate how hypsometric creates breaks based on elevation. Those breaks almost create the appearance of an enumeration units (knowing that there are no enumeration units, but instead points).

I feel the map, with it's symbology, shows use where precipitation is greatest by elevation where as the continuous map shows us a more general trend in precipitation.

This map presents us the 30 year average of rainfall over the state of Washington. It uses hypsometic symbology  and contour lines (see above). The data was created using PRISM. PRISM uses point data underlined with elevation and is related to "climate fingerprint" or the historical weather pattern of an area based on it's physiology (mountains, etc.).  

Friday, March 4, 2016

Data Searchin'

Week 7 and 8 was all about hunting for the data. That meant (literal) hours of downloading from the various websites (FGDL and Labins). Given the fact I'm in the People's (non) Republic of China, the internet is not the fastest especially when I have my VPN running to get to most of the data.

Once I had the data I wanted, it was time to build the map in Arc. The first issue I encountered was the projection. Initially, I added the vector data I wanted and then projected that data into State Plane. I then added the raster data (aerials) and it ended up somewhere in the atlantic despite having the same datum and projection as the frame. This was well, annoying. I did a lot of research and a few GIS blogs mentioned that with projections, UTM and state plane were troublesome in ARC. After some troubleshooting of my own, I decided to see if the order in which I "layered" the map would make a difference...and it did. Hopefully this wasn't something I glossed over in this course. So I put in the raster data first, then the vector and it all lined up. I could project and reproject to my heart's content and all was well.

St. Joseph Bay Invasive Plants:
I decided to go with wetlands in my map, however, Gulf county Florida seems to be nothing but wetlands...I then added a managed (conservation) layer (that I clipped). I clipped the wetlands layer to the managed layer. So now my map only shows wetlands inside the managed areas (surprisingly, not much given the sensitivity). I used this in my St. Jospeh bay map. I then layered the invasive plants layer on top. I finally added an aerial of St. Joseph state park (with the plants on top).  I added a insert to show the location within Gulf county. Everything is projected in State Plane.


Invasive Plants in Managed Areas, Gulf County, FL
I overlaid the managed areas with the state park layer and the Fish and Wildlife Commission managed areas layer so in my invasive plant wide Gulf county map, you could see who owns what. The pink is privately managed land. In the southern portion of the FWC area, the invasive plants clump up, so I created an insert to make out it better.    Everything is projected in State Plane.  

DEM Gulf County

This one was pretty straight forward. Also, I didn't reporject. The DEM is in Albers Conical. I realized though, I should've added a blue background Gulf of Mexico and St. Joseph Bay). My original thinking was that the 0 elevation would line up with the Gulf. However, not a great idea.